What is tracer kinetic modeling?
 Let’s use dynamic 18F-FDG positron emission tomography (PET) imaging as an example. Standard PET imaging in the clinic and research is commonly performed with static scanning which only takes a picture of the subject at a late time point (e.g., one-hour post tracer injection). The standardized uptake value (SUV) is then calculated as a semi-quantitative index of tracer uptake.
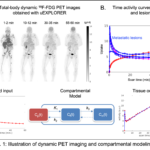
 Dynamic PET imaging starts data acquisition immediately after the tracer injection to capture the spatiotemporal distribution of the tracer (18F-FDG in this case), just like making a movie (Fig. 1A). A time-activity curve (TAC) can be extracted from a region of interest (ROI). Each TAC represents how tracer uptake changes over time in a region. TACs may be very different across regions (Fig. 1B).
The underlying molecular process of 18F-FDG corresponds to the first stage of cellular glycolysis of glucose. The tracer is first transported from the plasma to tissue cells and then phosphorylated inside the tissue cells. This process can be modeled using a three-compartment model (FDG in the plasma, free FDG in the tissue space, and metabolized FDG in the tissue) as shown in Fig. 1C. The rates of transfer between compartments are then estimated by fitting a tissue TAC using the derived mathematical model and the input function extracted from a blood region (e.g., the ascending aorta).
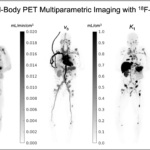
Kinetic modeling is conventionally performed on ROIs for regional quantification of kinetic parameters. When it is implemented voxel-by-voxel in the image space, parametric images of kinetic parameters can be generated. Fig. 2 shows a recent example of parametric imaging of multiple kinetic parameters for a total-body dynamic FDG-PET scan of a cancer patient (Wang et al, Journal of Nuclear Medicine, 2021).
How is kinetic modeling useful?
Dynamic PET with tracer kinetic modeling enables quantification of blood flow (e.g. with 11C-butanol), glucose metabolism (e.g. with 18F-FDG), ligand-receptor binding, and many other molecular processes, which cannot be done with static imaging. The enabled quantitative measures may lead to better evaluation and differentiation of health and disease states, and potentially improve monitoring of treatment response as compared to SUV.
The multiparametric aspect of tracer kinetic modeling also adds benefits. For example, kinetic modeling of dynamic FDG-PET data not only provides a quantitative measure of glucose metabolism using the FDG influx rate Ki (or SUV), but also offers the FDG transport rate K1 as shown in Fig. 2, which alone or in the combined transport/metabolism form may be explored for novel clinical applications.
Read Case Studies to understand more about applying kinetic modeling to various applications.
What imaging modality does it apply to?
The principle and techniques of tracer kinetic modeling are widely used in molecular imaging with dynamic PET. The methods also apply to dynamic magnetic resonance imaging (MRI) and computed tomography (CT), e.g., for perfusion imaging.